Measuring Performance
MS and FPS
- Use game window stats, frame debugger, and profiler.
- Compare dynamic batching, GPU instancing, and SRP batcher.
- Display a frame rate counter.
- Cycle through functions automatically.
- Smoothly transition between functions.
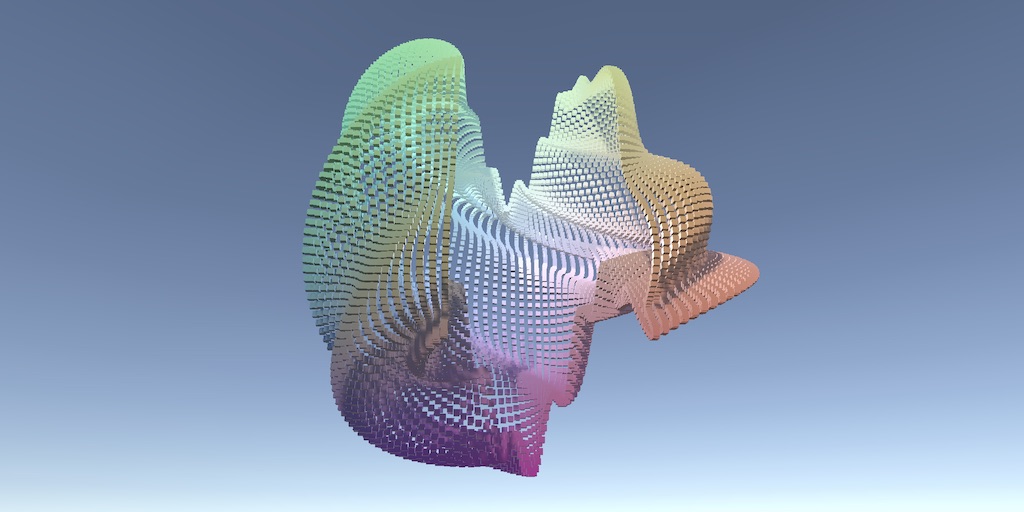
This is the fourth tutorial in a series about learning the basics of working with Unity. It's an introduction to measuring performance. We'll also add the ability to morph functions to our function library.
This tutorial is made with Unity 2020.3.6f1.
Profiling Unity
Unity continuously renders new frames. To make anything that moves appear fluid it has to do this fast enough so we perceive the sequence of images as continuous motion. Typically 30 frames per second—FPS for short—is the minimum to aim for and 60FPS is ideal. These numbers appear often because many devices have a display refresh rate of 60 hertz. You cannot draw frames faster than that without turning VSync off, which will cause image tearing. If consistent 60FPS cannot be achieved then the next best rate is 30FPS, which is once per two display refreshes. One step lower would be 15 FPS, which is insufficient for fluid motion.
Whether a target frame rate can be achieved depends on how long it takes to process individual frames. To reach 60FPS we must update and render each frame in less than 16.67 milliseconds. The time budget for 30FPS is double that, thus 33.33ms per frame.
When our graph is running we can get a sense of how smooth its motion is by simply observing it, but this is a very imprecise way to measure its performance. If motion appears smooth then it probably exceeds 30FPS and if it appears to stutter it's probably less than that. It might also be smooth one moment and stutter the next, due to inconsistent performance. This can be caused by variation in our app, but also due to other apps running on the same device. The Unity editor can also have inconsistent performance depending on what it's doing. If we barely reached 60FPS then we could end up going back and forth between 30FPS and 60FPS rapidly, which would feel jittery despite a high average FPS. So to get a good idea of what's going on we have to measure performance more precisely. Unity has a few tools to help us with this.
Game Window Statistics
The game window has a Statistics overlay panel that can be activated via its Stats toolbar button. It displays measurements taken for the last rendered frame. It doesn't tell us much, but it's the simplest tool that we can use to get an indication of what's going on. While in edit mode the game windows usually updates only sporadically, after something changed. It refreshes every frame while in play mode.
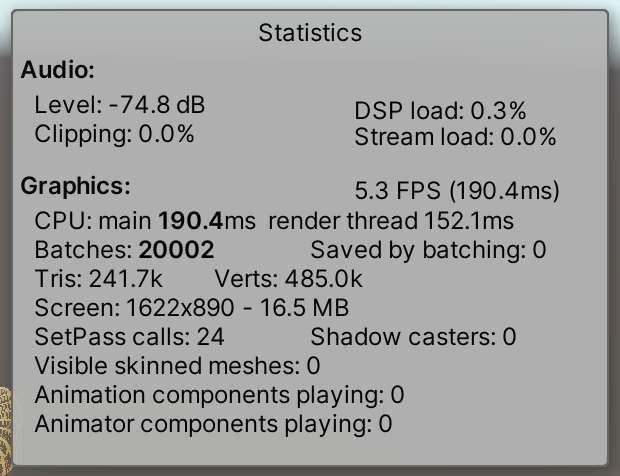
The following statistics are for our graph with the torus function and resolution at 100, using the default built-in render pipeline, which I'll refer to as BRP from now on. I have VSync turned on for the game window, so refreshes are synchronized with my 60 Hz display.
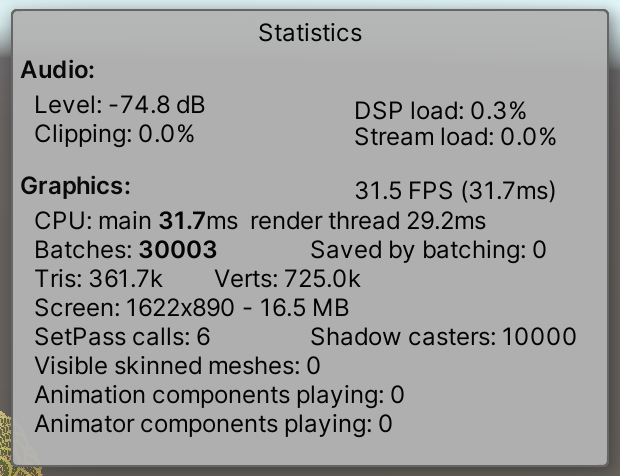
The statistics show a frame during which the CPU main thread took 31.7ms and the render thread took 29.2ms. You'll likely get different results, depending on your hardware and the game window screen size. In my case it suggests that the entire frame took 60.9ms to render, but the statistics panel reported 31.5FPS, matching the CPU time. The FPS indicator seems to takes the worst time and assumes that matches the frame rate. This is an oversimplification that only takes the CPU side into account, ignoring the GPU and display. The real frame rate is likely lower.
Besides the durations and FPS indication the statistics panel also displays various details about what was rendered. There were 30.003 batches, and apparently zero saved by batching. These are draw commands sent to the GPU. Our graph contains 10,000 points, so it appears that each point got rendered three times. That's once for a depth pass, once for shadow casters—listed separately as well—and once to render the final cube, per point. The other three batches are for additional work like the sky box and shadow processing that is independent of our graph. There were also six set-pass calls, which can be thought of as the GPU getting reconfigured to render in a different way, like with a different material.
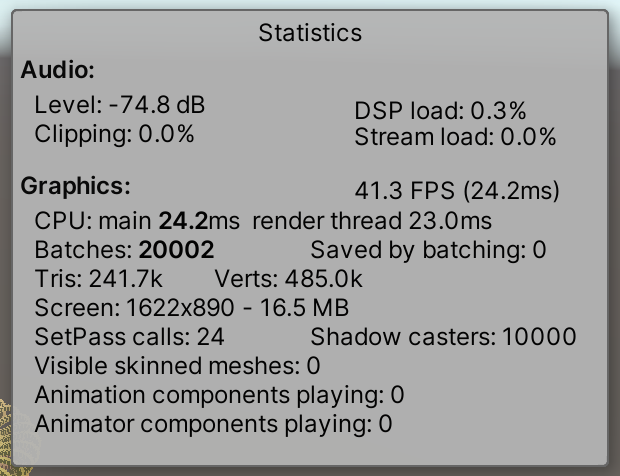
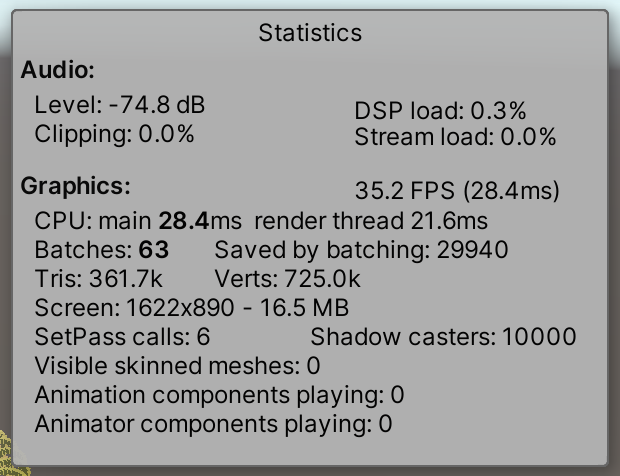
If we use URP instead the statistics are different. It renders faster. It's easy to see why: there are only 20.002 batches, 10.001 less than for BRP. That's because URP doesn't use a separate depth pass for directional shadows. It does have more set-pass calls, but that doesn't appear to be a problem.
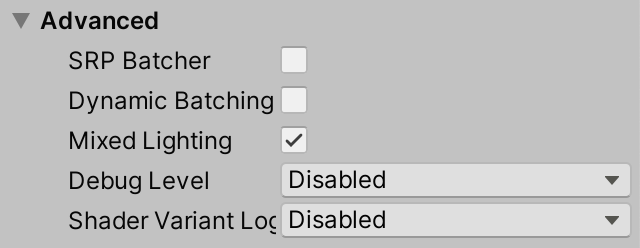
Although Saved by batching reports no batching, URP uses the SRP batcher by default, but the statistics panel doesn't understand it. The SRP batcher doesn't eliminate individual draw commands but can make them much more efficient. To illustrate this select our URP asset and disable SRP Batcher under the Advanced section at the bottom of its inspector. Make sure that Dynamic Batching is disabled as well.
With the SRP batcher disabled URP performance is much worse.
Dynamic Batching
Besides the SRP Batcher URP has another toggle for dynamic batching. This is an old technique that dynamically combines small meshes into a single larger one which then gets rendered instead. Enabling it for URP reduces batches to 10.024 and the statistics panel indicates that 9.978 draws were eliminated.
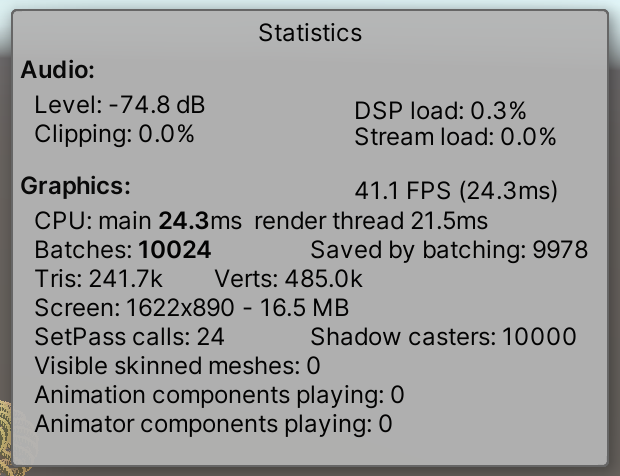
In my case the SRP batcher and dynamic batching have comparable performance, because the cube meshes of our graph's points are ideal candidates for dynamic batching.
The SRP batches isn't available for BRP, but we can enable dynamic batching for it. In this case we can find the toggle in the Other Settings section of the Player project settings, a bit below from where we set color space to linear. It's only visible when no scriptable render pipeline settings are used.
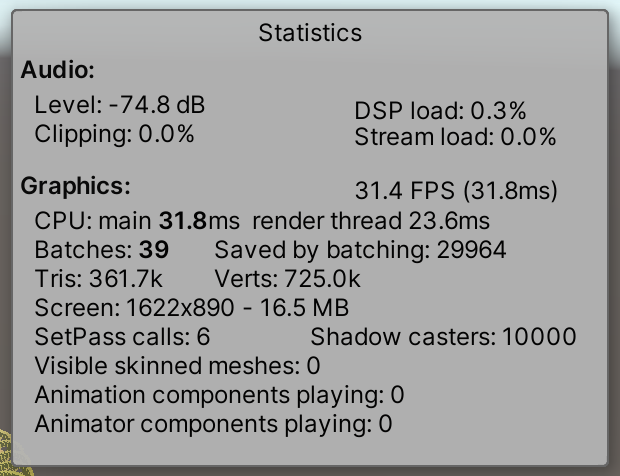
Dynamic batching is much more efficient for BRP, eliminating 29.964 batches, reducing them to only 39, but it doesn't appear to help much.
GPU Instancing
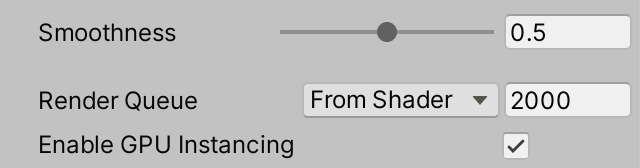
Another way to improve rendering performance is by enabling GPU instancing. This makes it possible to use a single draw command to tell the GPU to draw many instances of one mesh with the same material, providing an array of transformation matrices and optionally other instance data. In this case we have to enable it per material. Ours have an Enable GPU Instancing toggle for it.
URP prefers the SRP batcher over GPU instancing, so to make it work for our points the SRP batcher has to be disabled. We can then see that the amount of batches is reduced to just 46, much better than dynamic batching. We'll discover the reason for this difference later.
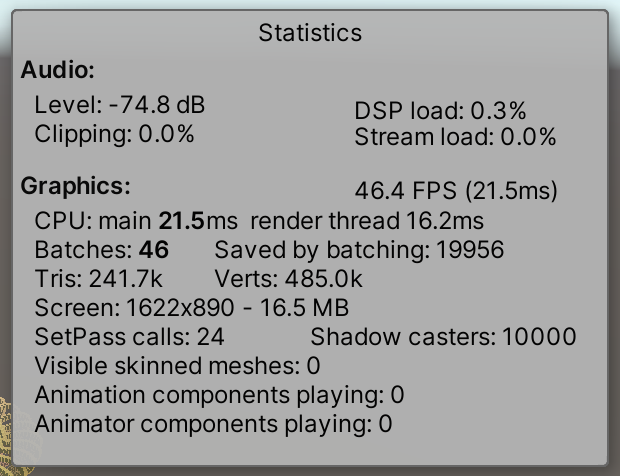
We could conclude from this data that for URP GPU Instancing is best, followed by dynamic batching, and then the SRP batcher. But the difference is small, so they seem effectively equivalent for our graph. The only clear conclusion is that either GPU instancing or the SRP batcher should be used.
For BRP GPU instancing results in more batches than dynamic batching, but the frame rate is a little bit higher.
Frame Debugger
The statistics panel can tell us that using dynamic batching is different than using GPU instancing, but doesn't tell us why. To get a better understanding of what's going on we can use the frame debugger, opened via Window / Analysis / Frame Debugger. When enabled via its toolbar button it shows a list of all draw commands sent to the GPU for the last frame of the game window, grouped under profiling samples. This list is shown on its left side. On its right side details are shown of a specific selected draw command. Also, the game window shows the progressive draw state until directly after the selected command.
In our case we must be in play mode, because that's when our graph gets drawn. Enabling the frame debugger will pause play mode, which allows us to inspect the draw command hierarchy. Let's first do this for BRP, without using dynamic batching nor GPU instancing.
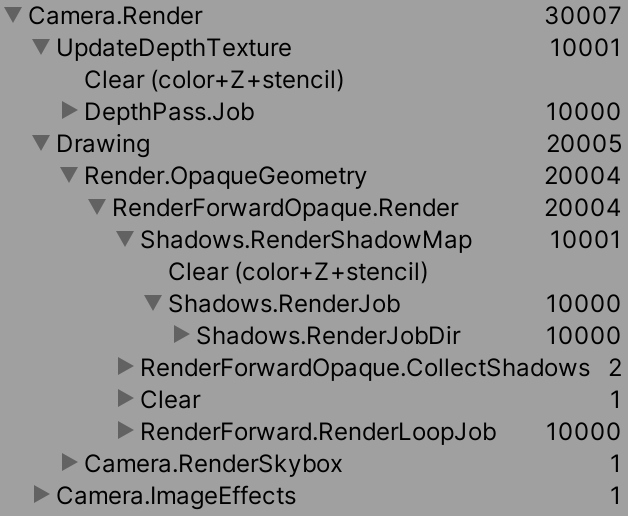
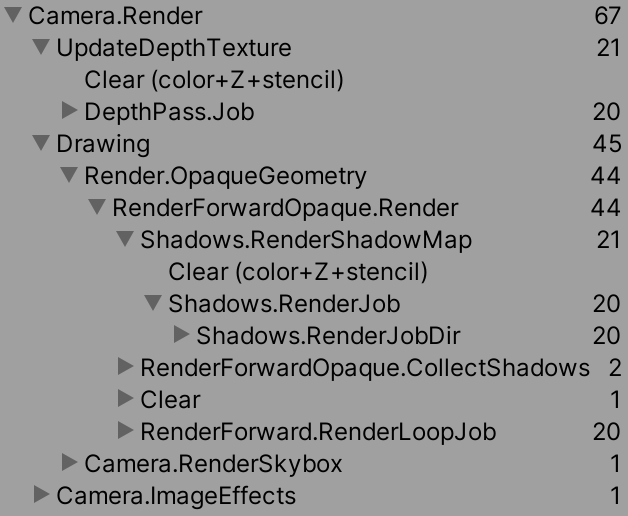
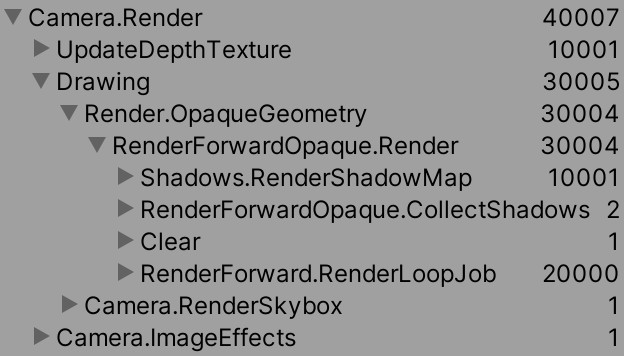
We see a total of 30.007 draw calls, more than the statistics panel reported because there are also commands that aren't counted as batches, such as clearing a target buffer. The 30,000 draws for our points are individually listed as Draw Mesh Point(Clone), under DepthPass.Job, Shadows.RenderDirJob, and RenderForward.RenderLoopJob.
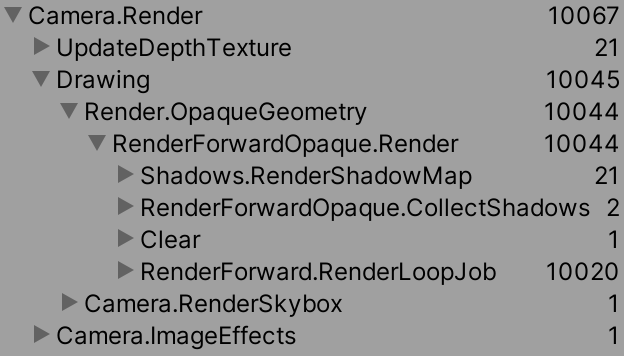
If we try again with dynamic batching enabled the command structure remains the same, except that each group of 10,000 draws is reduced to twelve Draw Dynamic calls. This is a significant improvement in terms of CPU-GPU communication overhead.
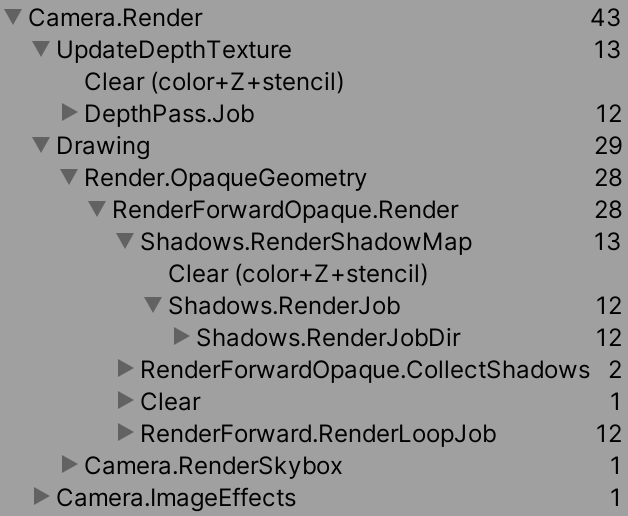
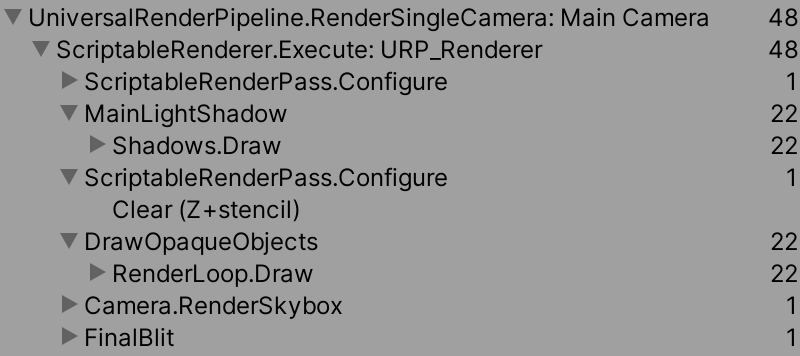
And if we use GPU instancing then each group gets reduced to 20 Draw Mesh (Instanced) Point(Clone) calls instead. Again a big improvement, but a different approach.
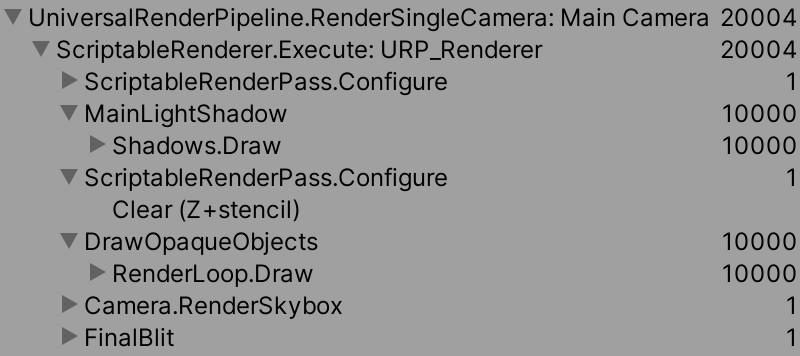
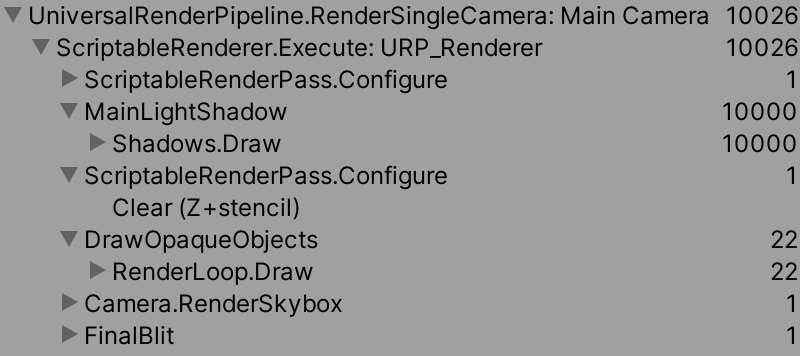
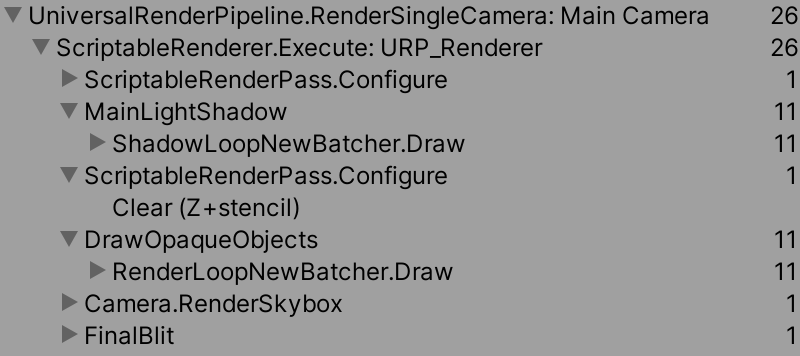
We can see the same happen for URP, but with a different command hierarchy. In this case the points are drawn twice, first under Shadows.Draw and again under RenderLoop.Draw. A significant difference is that dynamic batching doesn't appear to work for the shadow map, which explains why it's less effective for URP. We also end up with 22 batches instead of only twelve, indicating that the URP material relies on more mesh vertex data than the standard BRP one, so less points fit in a single batch. Unlike dynamic batching GPU instancing does work for shadows, so it is superior in this case.
Finally, with the SRP batcher enabled drawing 10,000 points gets listed as 11 SRP Batch commands, but keep in mind that these are still individual draw calls, just very efficient ones.
An Extra Light
The results that we got so far are for our graph, with a single directional light, and the other project settings that we use. Let's see what happens when we add a second light to the scene, specifically a point light via GameObject / Light / Point Light. Set its position to zero and make sure that it doesn't cast shadows, which is its default behavior. BRP supports shadows for point lights, but URP still doesn't.
With the extra light BRP now draws all points an additional time. The frame debugger shows us that RenderForward.RenderLoopJob renders twice as much as before. Even worse, dynamic batching now only works for the depth and shadow passes, not the forward passes.

This happens because BRP draws each object once per light. It has a main pass that works with a single directional light, followed by additional passes are rendered on top of it. This happens because it's an old-fashioned forward-additive render pipeline. Dynamic batching cannot handle these different passes, so doesn't get used.
The same is true for GPU instancing, except that it still works for the main pass. Only the additional light passes don't benefit from it.
The second light appears to make no difference for URP, because it is a modern forward renderer that applies all lighting in a single pass. So the command list remains the same, even though the GPU needs to perform more lighting calculations per draw.
These conclusions are for a single extra light that affects all points. If you add more lights and move them such that different points are affected by different lights things get more complicated and batches can get split up when GPU instancing is used. What's true for a simple scene might not be true for a complex one.
Profiler
To get a better idea of what's happening on the CPU side we can open the profiler window. Turn off the point light and open the window via Window / Analysis / Profiler. It will record performance data while in play mode and store it for later inspection.
The profiler is split in two sections. Its top portion contains a list of modules that show various performance graphs. The top one is CPU Usage, which is what we'll focus on. With that module selected the bottom part of the window shows a detailed breakdown of a frame that we can select in the graph.
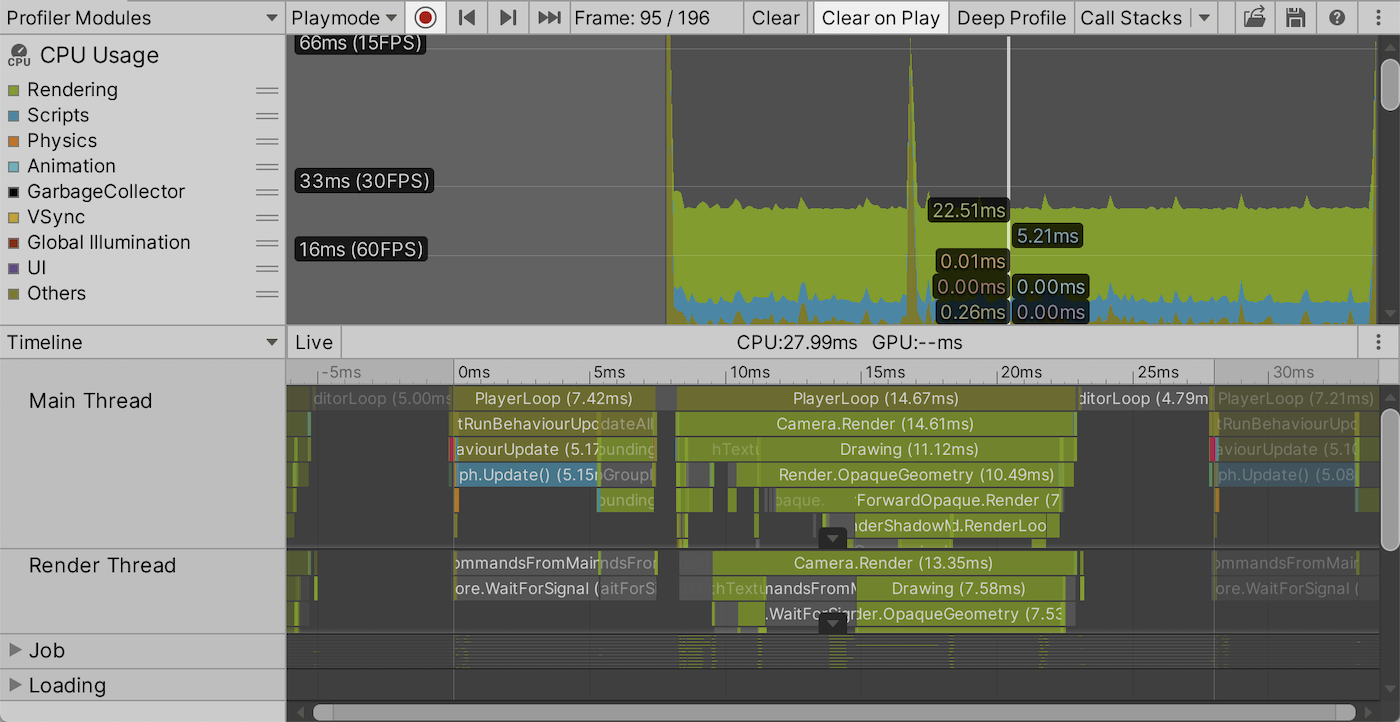
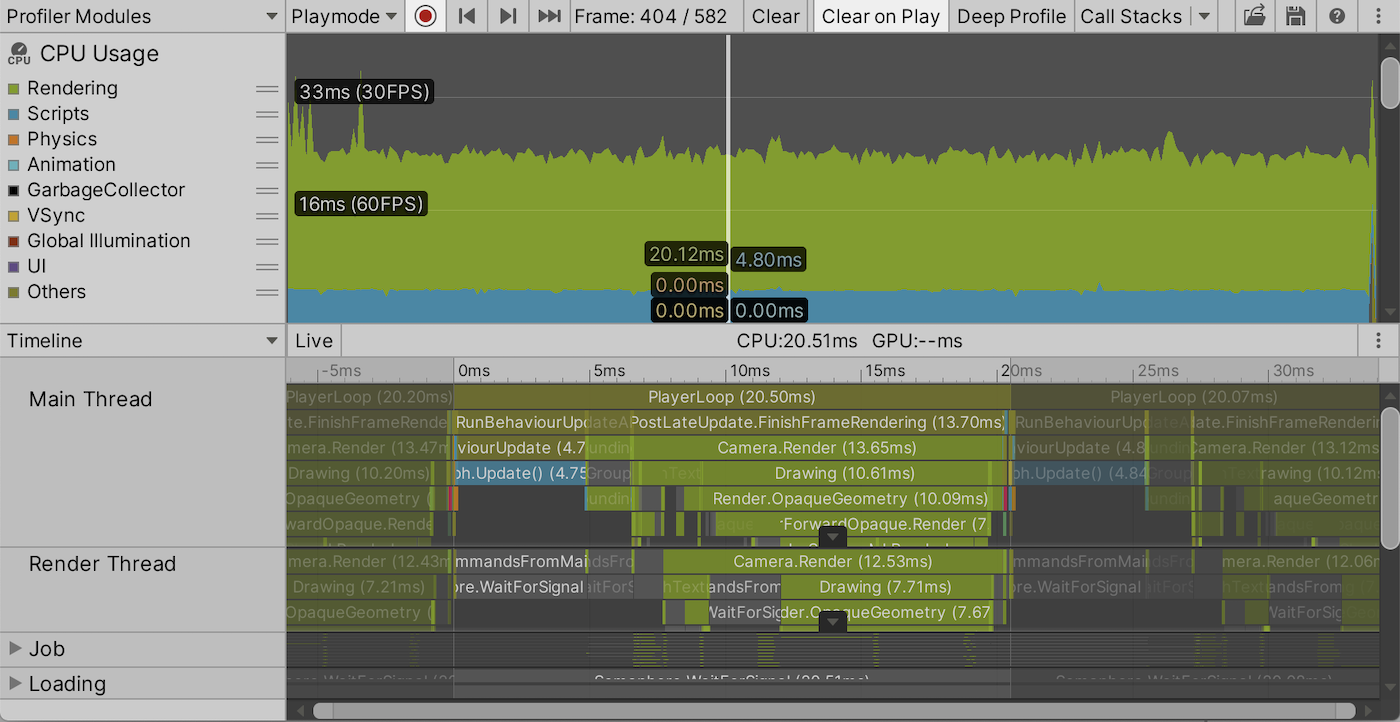
The default bottom view for CPU usage is the timeline. It visualizes how much time was spent on what during a frame. It shows that each frame begins with PlayerLoop, which spends most of its time invoking RunBehaviourUpdate. Two steps further down we see that it's mostly the invocation of our Graph.Update method. You can select a timeline block to see its full name and duration in milliseconds.
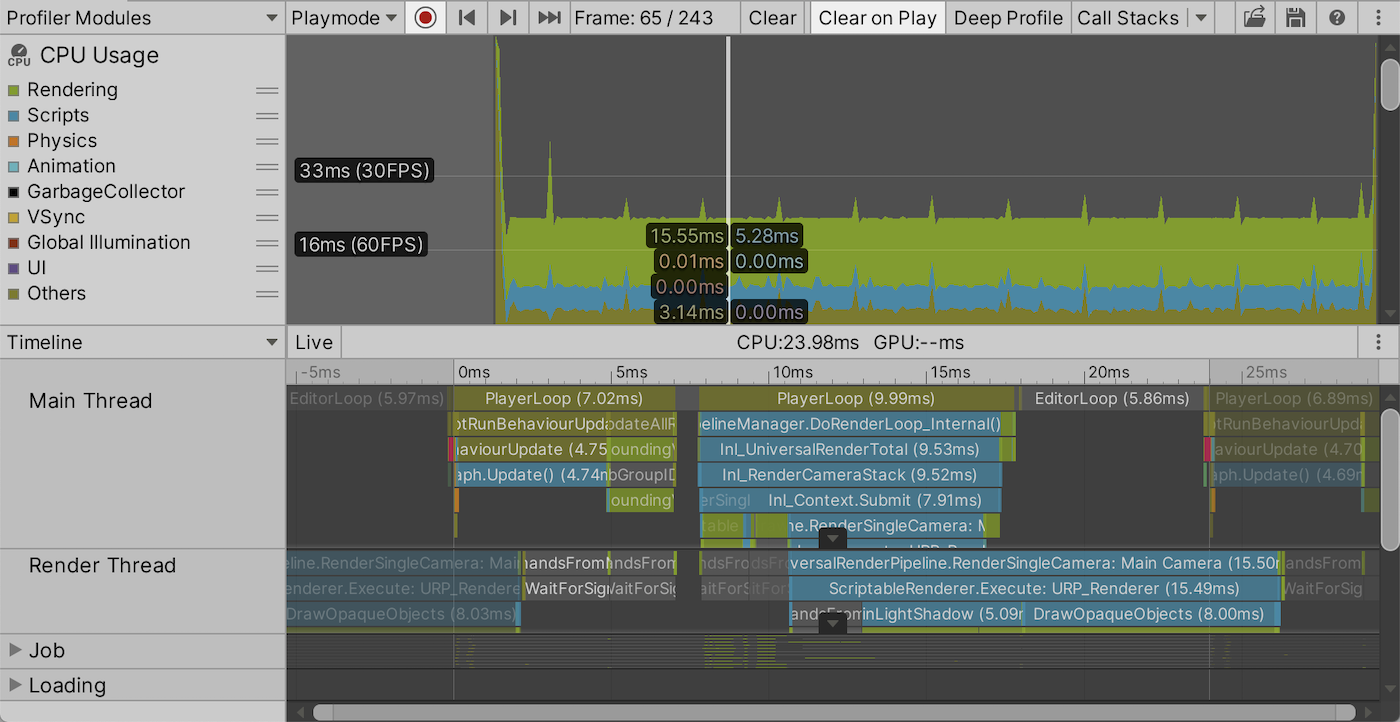
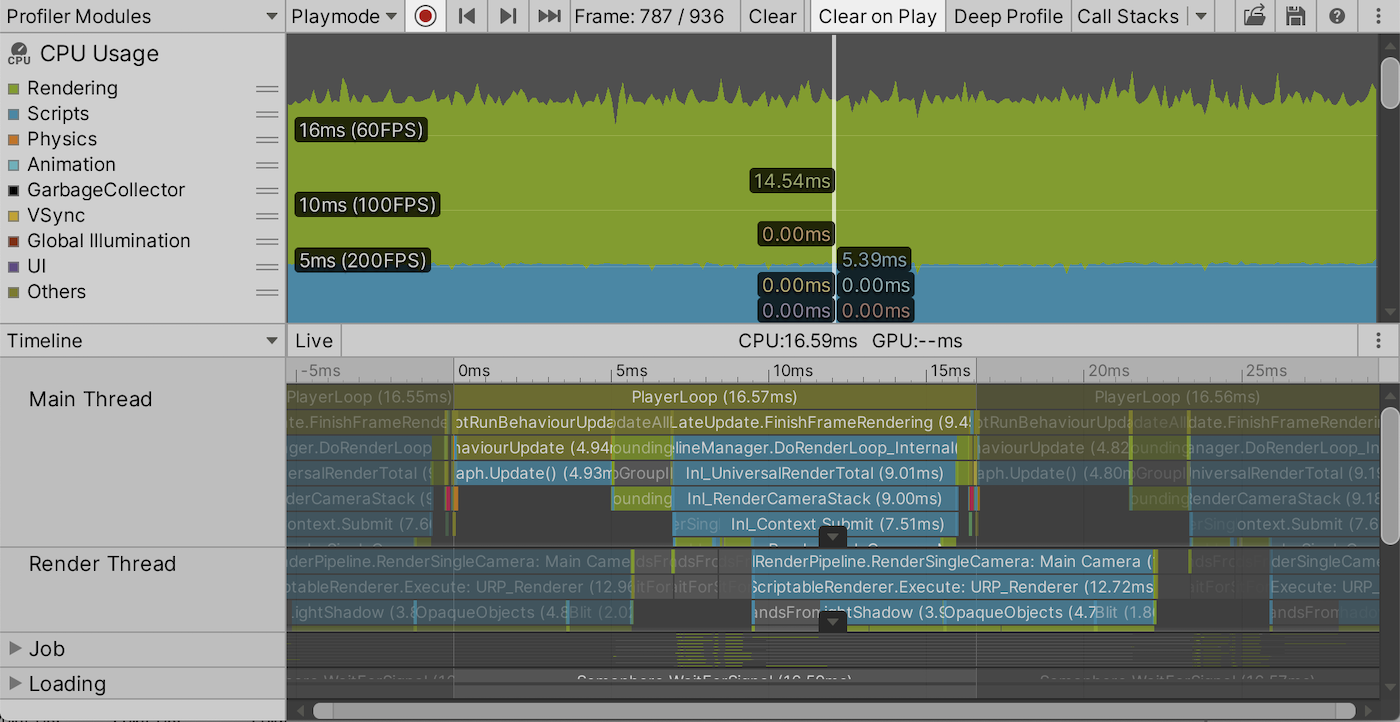
After the initial player loop segments comes a short EditorLoop part, after which comes another player segment for the rendering part of the frame where the CPU tells the GPU what to do. The work is split between the main thread, the render thread, and a few job worker threads, but the specific approach is different for BRP and URP. These threads run in parallel but also have synchronization points when one has to wait for the results of another.
After the render portion—while the render thread is still busy if URP is used—comes another editor segment, after which the next frame begins. The threads can also appear to cross frame boundaries. This happens because Unity can start the update loop of the next frame on the main thread before the render thread is finished, exploiting parallelism. We'll get back to this later in the next section.
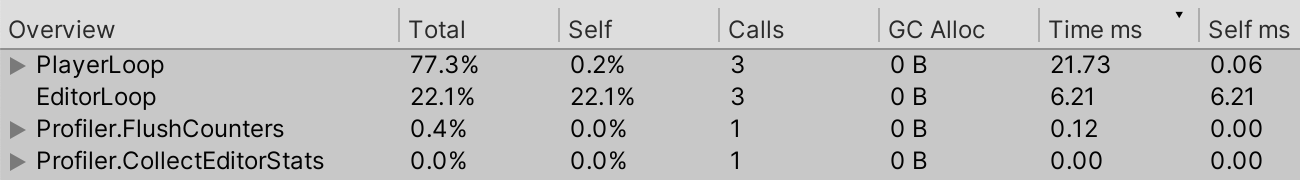
If you're not interested in the exact timing of threads then you can replace the Timeline view with the Hierarchy view via the dropdown list on the left side. The hierarchy displays the same data in a single a sortable list. This view makes it easier to see what takes longest and where memory allocation happens.
Profiling a Build
The profiler makes it obvious that the editor adds a lot of overhead to our app. It's thus much more useful to profile our app when it is running on its own. To to this we have to build our app, specifically for debugging. We can configure how our app is built in the Build Settings window, opened via File / Build Settings.... If you haven't configured it yet the Scenes in Build section is empty. This is fine because the currently open scene will be used by default.
You can pick your target platform, for which your current machine is the most convenient. Then enable the Development Build and Autoconnect Profiler options.
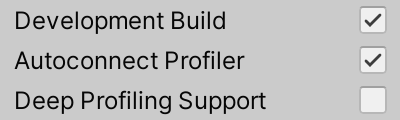
To finally create the standalone app—often refered to as a build—press the Build button, or Build and Run to immediately open the app once the build process is finished. You can also trigger another build via File / Build and Run or the indicated shortcut.
Once the build runs on its own quit it after a while and switch back to Unity. The profiler should now contain information about how it performed. This doesn't always happen after the first build, if so just try again. Also keep in mind that the profiler doesn't clear old data when attached to a build, even when Clear on Play is enabled, so make sure that you're looking at the relevant frames if you only ran the app a few seconds.
Because there is no editor overhead a build should perform better than play mode in the Unity editor. The profiler will indeed no longer show editor loop sections.
Showing the Frame Rate
We don't always need detailed profiling information, a rough indication of the frame rate will often suffice. Also, we—or someone else—might be running our app somewhere without a Unity editor available. What we could do for those cases is measure and display the frame in the app itself, in a small overlay panel. Such functionality isn't available by default, so we'll create it ourselves.
UI Panel
A small overlay panel can be created with Unity's in-game UI. We'll also use TextMeshPro to create text to display the frame rate. TextMeshPro is a separate package containing advanced text display functionality, superior to the default UI text component. If you don't have its package installed already add it via the package manager. This also automatically installs the Unity UI package because TextMeshPro depends on it.
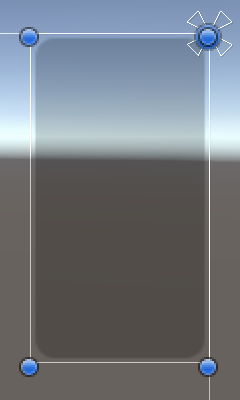
Once the UI package is part of the project create a panel via GameObject / UI / Panel. This creates a semitransparent panel that covers the entire UI canvas. The canvas matches the game window size, but is much bigger in the scene window. It's easiest to see it by enabling 2D mode via the scene window toolbar and then zooming out.
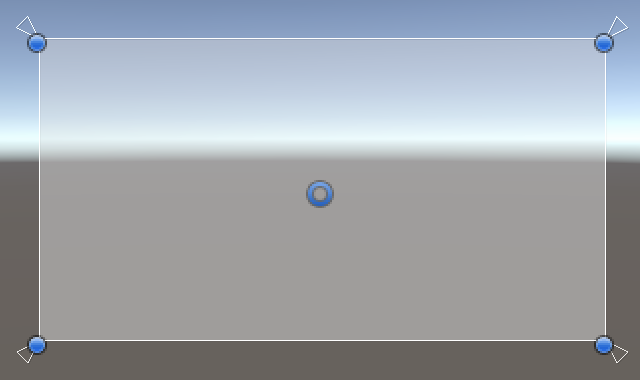
Each UI has a canvas root object, which got automatically created when we added a panel. The panel is a child of the canvas. An EventSystem game object got created as well, which is responsible for handling UI input events. We won't use those so can ignore or even delete it.

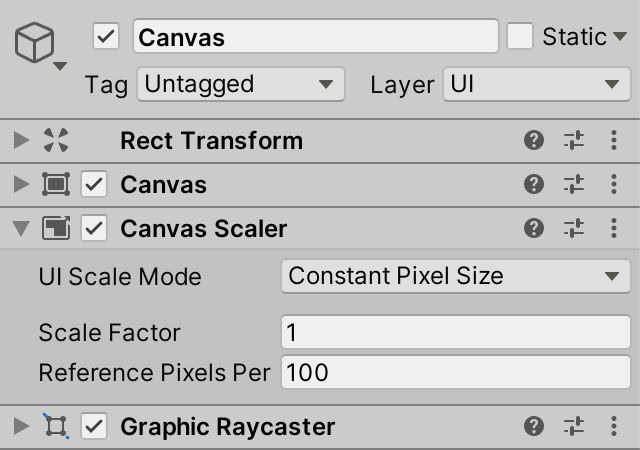
The canvas has a scaler component that can be used to configure the scale of the UI. The default settings assume a constant pixel size. If you're working with a high-resolution or retina display then you'd have to increase the scale factor otherwise the UI will be too small. There are also other scale modes that you can experiment with.
UI game objects have a specialized RectTransform component that replaces the usual Transform component. Besides the usual position, rotation, and scale it exposes extra properties based on the anchors. The anchors control the relative position and resizing behavior of an object relative to its parent. The easiest way to change it is via the popup window that is opened by clicking the square anchor image.
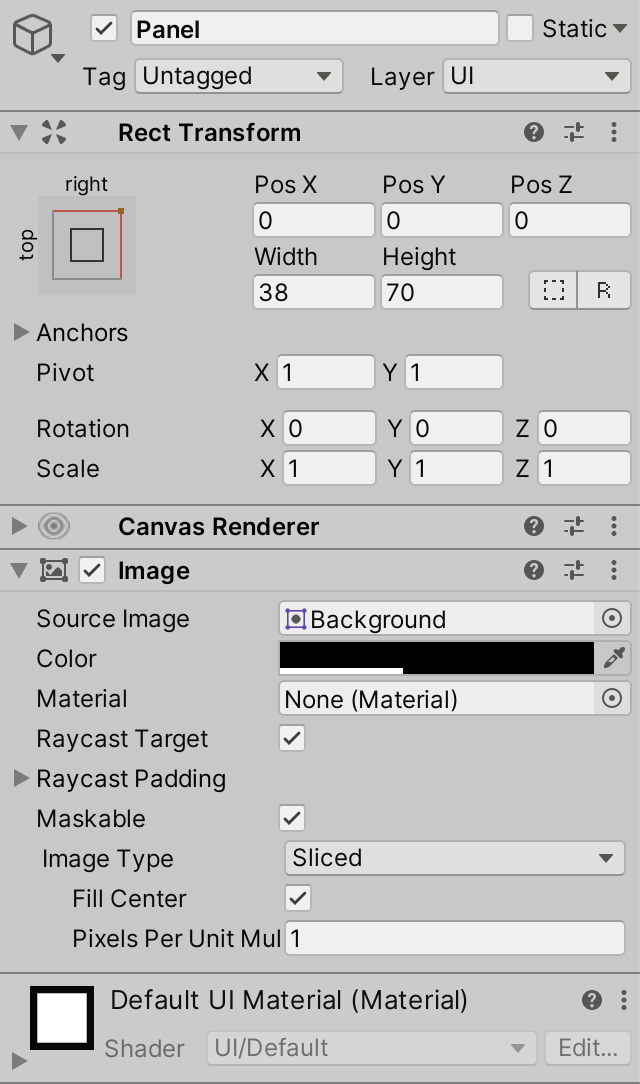
We'll put the frame rate counter panel at the top right of the window so set the panel's anchors to top right and the pivot XY to 1. Then set width to 38 and height to 70 and the position to zero. After that, set the color of the image component to black, keeping its alpha as it was.
Text
To put text in the panel create a TextMeshPro UI text element via GameObject / UI / Text - TextMeshPro. If this is the first time that you create a TextMeshPro object an Import TMP Essentials popup will show up. Import the essentials as suggested. This will create a TextMesh Pro asset folder with some assets in it, which we won't need to directly deal with.
Once the text game object is created make it a child of the panel, set its anchor to stretch mode in both dimensions. Make it overlap the entire panel, which can be done by setting left, top, right, and bottom to zero. Also give it a descriptive name, like Frame Rate Text.
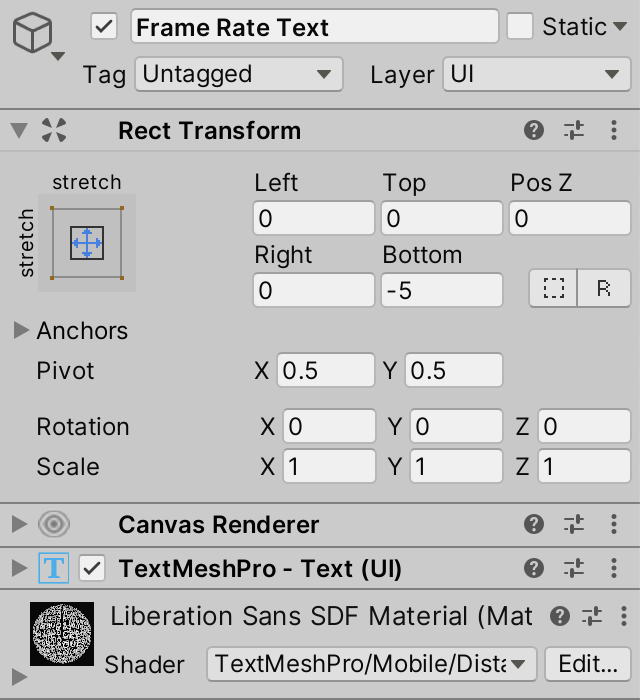
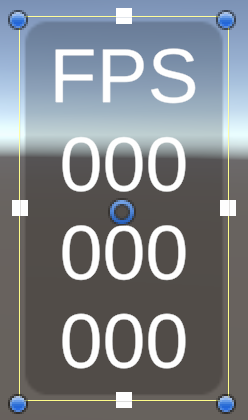
Next, make a few adjustments to the TextMeshPro - Text (UI) component. Set Font Size to 14 and Alignment to center middle. Then fill the Text Input area with placeholder text, specifically FPS followed by three lines with three zeros each.
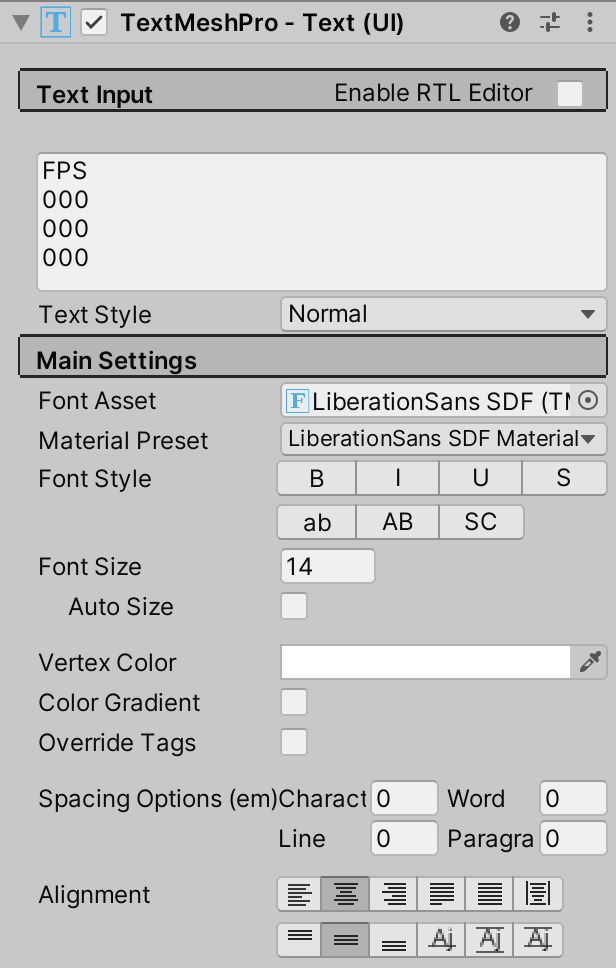
We can now see what our frame rate counter will look like. The three rows or zeros are placeholders for the statistics that we'll display shortly.
Updating the Display
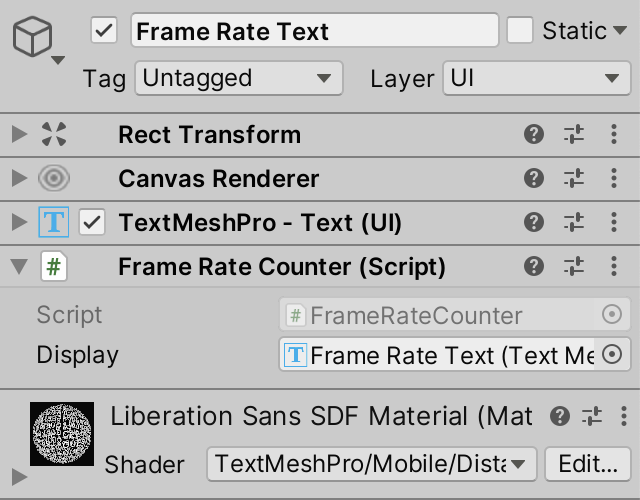
To update the counter we need a custom component. Create a new C# script asset for a FrameRateCounter component. Give it a serializable TMPro.TextMeshProUGUI field to hold a reference to the text component used for displaying its data.
using UnityEngine;
using TMPro;

public class FrameRateCounter : MonoBehaviour {

	[SerializeField]
	TextMeshProUGUI display;
}
Add this component to the text object and hook up the display.
To display the frame rate we need to know how much time has passed between the previous and current frame. This information is available via Time.deltaTime. However, this value is subject to a time scale that could be used for slow-motion, fast-forward, or completely stopping time. We need to use Time.unscaledDeltaTime instead. Retrieve it at the start of a new Update method in FrameRateCounter.
	void Update () {
		float frameDuration = Time.unscaledDeltaTime;
	}
The next step is to adjust the displayed text. We can do this by invoking its SetText method with a text string argument. Let's start with supplying the same placeholder text that we already have. A string is written between double quotes and a newline is written with the special \n character sequence.
		float frameDuration = Time.unscaledDeltaTime;
		display.SetText("FPS\n000\n000\n000");
TextMeshProUGUI has variant SetText methods that accept additional float arguments. Add the frame duration as a second argument and then replace the first triple-zero line of our string with a single zero within curly brackets. That indicates where the float argument should be inserted in the string.
display.SetText("FPS\n{0}\n000\n000", frameDuration);
The frame duration tells us how much time elapsed. To show the frame rate expresses as frames per second we have to display its inverse, so one divided by the frame duration.
display.SetText("FPS\n{0}\n000\n000", 1f / frameDuration);
This will show a meaningful value, but it will have lots of digits, like 59.823424. We can instruct the text to round to a specific number of digits after the decimal point, by following the zero with a colon and the desired number. We'll round to a whole number, so add zero.
display.SetText("FPS\n{0:0}\n000\n000", 1f / frameDuration);
Average Frame Rate
The displayed frame rate ends up changing rapidly, because the time between successive frames is almost never exactly the same. We can make it less erratic by showing a frame rate average instead of only the rate for the last frame. We do that by keeping track of how many frames have been rendered and the total duration, then showing the amount of frames divided by their combined duration.
	int frames;

	float duration;

	void Update () {
		float frameDuration = Time.unscaledDeltaTime;
		frames += 1;
		duration += frameDuration;
		display.SetText("FPS\n{0:0}\n000\n000", frames / duration);
	}
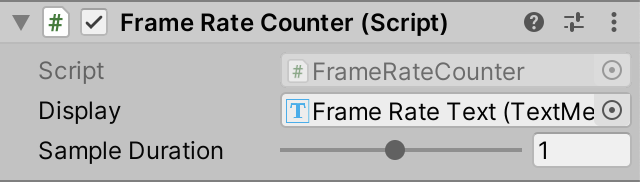
This will make our counter trend toward a stable average the longer it runs, but this average is for the entire run time of our app. As we want recent information we have to reset and start over frequently, sampling a new average. We can make this configurable by adding a serializable sample duration field, set to one second by default. Give it a resonable range, like 0.1–2. The shorter the duration to more precise a result we get, but it will be harder to read as it changes more rapidly.
	[SerializeField]
	TextMeshProUGUI display;

	[SerializeField, Range(0.1f, 2f)]
	float sampleDuration = 1f;
From now on we'll only adjust the display when the accumulated duration equals or exceeds the configured sample duration. We can check this with the >= greater-or-equal operator. After updating the display set the accumulated frame and duration back to zero.
	void Update () {
		float frameDuration = Time.unscaledDeltaTime;
		frames += 1;
		duration += frameDuration;

		if (duration >= sampleDuration) {
			display.SetText("FPS\n{0:0}\n000\n000", frames / duration);
			frames = 0;
			duration = 0f;
		}
	}
Best and Worst
The average frame rate fluctuates because our app's performance isn't constant. It sometimes slows down either because it temporarily has more work to do or because other processes running on the same machine get in the way. To get an idea of how big these fluctuations are we'll also record and display the best and worst frame durations that occurred during the sample period. Set the best duration to float.MaxValue by default, which is the worst possible best duration.
float duration, bestDuration = float.MaxValue, worstDuration;
Each update check whether the current frame duration is less than the best duration so far. If so make it the new best duration. Also check if the current frame duration is greater than the worst duration so far. If so make it the new worst duration.
	void Update () {
		float frameDuration = Time.unscaledDeltaTime;
		frames += 1;
		duration += frameDuration;

		if (frameDuration < bestDuration) {
			bestDuration = frameDuration;
		}
		if (frameDuration > worstDuration) {
			worstDuration = frameDuration;
		}

		…
	}
We'll now put the best frame rate on the first line, the average on the second line, and the worst on the last. We can do this by adding two more arguments to SetText and adding more placeholders to the string. They are indices, so the first number is indicated with 0, the second with 1, and the third with 2. After that also reset the best and worst durations.
		if (duration >= sampleDuration) {
			display.SetText(
				"FPS\n{0:0}\n{1:0}\n{2:0}",
				1f / bestDuration,
				frames / duration,
				1f / worstDuration
			);
			frames = 0;
			duration = 0f;
			bestDuration = float.MaxValue;
			worstDuration = 0f;
		}
Note that the best frame rate can exceed the display refresh rate, even when VSync is enabled. Likewise the worst frame rate doesn't have to be a multiple of the display refresh rate. This is possible because we're not measuring the duration between displayed frames. We're measuring the duration between Unity frames, which are iterations of its update loop. Unity's update loop isn't perfectly synchronized with the display. We already saw a hint of that when the profiler showed that the player loop of the next frame started while the render thread of the current frame was still busy. And after the render thread is finished the GPU still has some work to do, and after that it will still take some time before the display refreshes. So the FPS that we display isn't the real frame rate, it's what Unity tells us it is. Ideally these are the same, but getting that right is complicated. There is a Unity blog post about how Unity is improving in this regard, but that doesn't even tell the entire story.
Frame Durations
Frames-per-second is a good unit to measure perceived performance, but when trying to reach a target frame rate it's more useful to display the frame duration instead. For example, when trying to achieve a stable 60FPS on a mobile device every millisecond counts. So let's add a display mode configuration option to our frame rate counter.
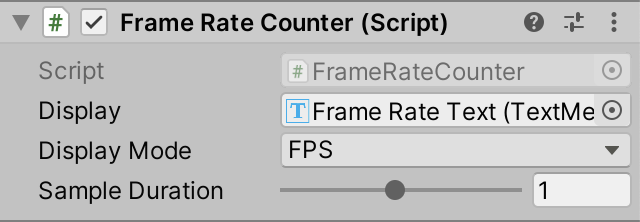
Define a DisplayMode enum for FPS and MS inside FrameRateCounter and then add a serializable field of that type, set to FPS by default.
	[SerializeField]
	TextMeshProUGUI display;

	public enum DisplayMode { FPS, MS }

	[SerializeField]
	DisplayMode displayMode = DisplayMode.FPS;
Then when we refresh the display in Update check whether the mode is set to FPS. If so do the same that we're already doing. Otherwise replace the FPS header with MS and use the inverse arguments. Multiply them with 1000 as well to convert from seconds to milliseconds.
		if (duration >= sampleDuration) {
			if (displayMode == DisplayMode.FPS) {
				display.SetText(
					"FPS\n{0:0}\n{1:0}\n{2:0}",
					1f / bestDuration,
					frames / duration,
					1f / worstDuration
				);
			}
			else {
				display.SetText(
					"MS\n{0:0}\n{1:0}\n{2:0}",
					1000f * bestDuration,
					1000f * duration / frames,
					1000f * worstDuration
				);
			}
			frames = 0;
			duration = 0f;
			bestDuration = float.MaxValue;
			worstDuration = 0f;
		}
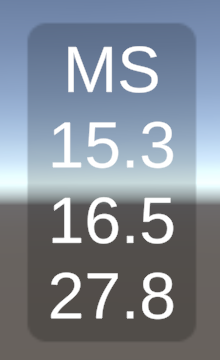
Frame durations are often measured in tenths of milliseconds. We can increase the precision of our display one step by increasing the digit rounding from zero to 1.
				display.SetText(
					"MS\n{0:1}\n{1:1}\n{2:1}",
					1000f * bestDuration,
					1000f * duration / frames,
					1000f * worstDuration
				);
Memory Allocations
Our frame rate counter is finished, but before moving on let's check how much it impacts performance. Showing the UI requires more draw calls per frame, but that doesn't really make a difference. Use the profiler in play mode and then search for a frame during which we update the text. It turns out that this doesn't take much time, but it does allocate memory. This is easiest to detect via the hierarchy view, sorting by the GC Alloc column.
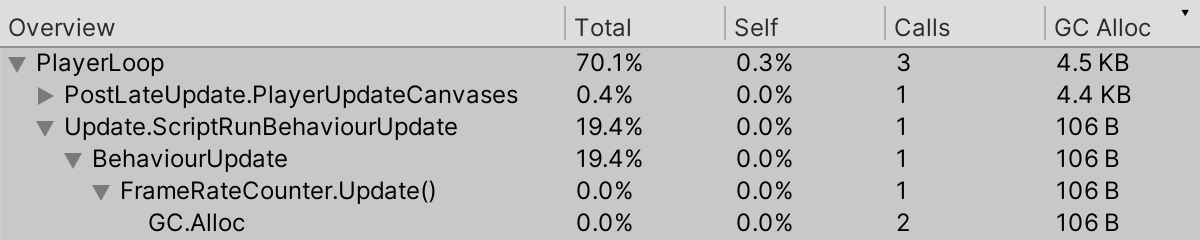
Text strings are objects. When we create a new one via SetText this produces a new string object, which is responsible for the allocation of 106 bytes. Unity's UI refresh then increases this to 4.5 kilobytes. While this isn't much it will accumulate, triggering a memory garbage collection process at some point which will result in an undesired frame duration spike.
It is important to be aware of memory allocation for temporary objects and eliminate recurring ones as much as possible. Fortunately SetText and Unity's UI update only perform these memory allocations in the editor, for various reasons, like updating the text input field. If we profile a build then we will find some initial allocations but then no more. So it is essential to profile builds. Profiling editor play mode is only good for a first impression.
Automatic Function Switching
Now that we know how to profile our app we can compare its performance when displaying different functions. If a function requires more calculations the CPU has to do more work, so that can lower the frame rate. How the points get calculated makes no difference to the GPU though. If the resolution is the same the GPU will have to do the same amount of work.
The biggest difference is between the wave and torus functions. We can compare their CPU usage via the profiler. We could either compare two separate runs with different functions configured, or profile in play mode and switch during play.
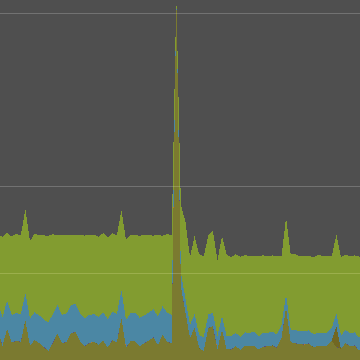
The CPU graph shows that indeed the load decreases after switching from torus to wave. There is also a massive frame duration spike when the switch happened. This happened because play mode is temporarily paused when a change is made via the editor. Some smaller spikes happened later as well due to deselection and editor focus changes.
The spikes fall under the Other category. The CPU graph can be filtered by toggling the category labels on the left side so we only see the relevant data. With the Other category disabled the change in the amount of calculations is more obvious.
Switching functions via the inspector is awkward for profiling due to the pauses. Even worse is that we have to make a new build to profile a different function. We could improve this by adding the ability to switch functions to our graph besides via its inspector, either automatically or via user input. We'll go for the first option in this tutorial.
Looping Through Functions
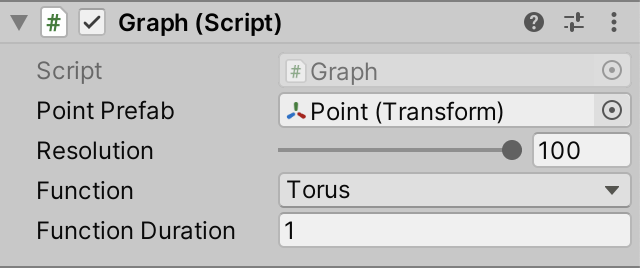
We're going to automatically loop through all functions. Each function will be shown for a fixed duration, after which the next one will be shown. To make the function duration configurable add a serializable field to Graph for it, with a default of one second. Also set its minimum to zero by giving it the Min attribute. A duration of zero would result is switching to a different function every frame.
	[SerializeField]
	FunctionLibrary.FunctionName function;

	[SerializeField, Min(0f)]
	float functionDuration = 1f;
From now on we'll need to keep track of how long the current function has been active and switch to the next one when needed. This will complicate our Update method. Its current code deals solely with updating the current function, so let's move it to a separate UpdateFunction method and have Update invoke it. This keeps our code organized.
	void Update () {
		UpdateFunction();
	}

	void UpdateFunction () {
		FunctionLibrary.Function f = FunctionLibrary.GetFunction(function);
		float time = Time.time;
		float step = 2f / resolution;
		float v = 0.5f * step - 1f;
		for (int i = 0, x = 0, z = 0; i < points.Length; i++, x++) { … }
	}
Now add a duration field and increase it by the—possibly scaled—delta time at the start of Update. Then if the duration equals or exceeds the configured duration reset it back to zero. After that comes the invocation of UpdateFunction.
	Transform[] points;

	float duration;

	…

	void Update () {
		duration += Time.deltaTime;
		if (duration >= functionDuration) {
			duration = 0f;
		}
		UpdateFunction();
	}
We'll most likely never exactly reach the function duration, we'll exceed it a little instead. We could ignore this, but to stay reasonably synchronized with the excepted timing of function switches we should deduct the extra time from the duration of the next function. We do this by subtracting the desired duration from the current duration instead of setting it to zero.
		if (duration >= functionDuration) {
			duration -= functionDuration;
		}
To loop through functions we'll add a GetNextFunctionName method to FunctionLibrary that takes a function name and returns the next one. As enums are integers we can just add one to its parameter and return that.
	public static FunctionName GetNextFunctionName (FunctionName name) {
		return name + 1;
	}
But we also have to loop back to the first function instead of moving past the last one, otherwise we would end up with an invalid name. Thus only if the provided name is less than the torus can we increase it. Otherwise we return the first function, which is the wave. We can do this with if-else blocks that each return the appropriate result.
		if (name < FunctionName.Torus) {
			return name + 1;
		}
		else {
			return FunctionName.Wave;
		}
We can make this method function-name agnostic by comparing the name—as an int—to the length of the functions array minus one, which matches the index of the last function. If we're at the end we can also return zero, which is the first index. The advantage of this approach is that we won't have to adjust the method if we change the function names later.
		if ((int)name < functions.Length - 1) {
			return name + 1;
		}
		else {
			return 0;
		}
It's also possible to reduce the method body to a single expression by using the ?: ternary conditional operator. It's an if-then-else expression with the ? and : separating its parts. Both alternatives must produce a value of the same type.
	public static FunctionName GetNextFunctionName (FunctionName name) {
		return (int)name < functions.Length - 1 ? name + 1 : 0;
	}
Use the new method in Graph.Update to switch to the next function when appropriate.
		if (duration >= functionDuration) {
			duration -= functionDuration;
			function = FunctionLibrary.GetNextFunctionName(function);
		}
We can now see the performance of all functions in sequence by profiling a build.
In my case the frame rate is the same for all functions because it never dropped below 60FPS. The differences are smoothed out by waiting for VSync. Profiling a build with VSync enable makes the difference more obvious. Alternatively, only show the scripts in the profiler.

It turns out that Wave is fastest, followed by Ripple, then Multi Wave, after that Sphere, and Torus is slowest. This matches what we would expect, knowing the code.
Random Functions
Let's make our graph a bit more interesting, by adding an option to switch between functions at random instead of cycling through a fixed sequence. Add a GetRandomFunctionName method to support this to FunctionLibrary. It can pick a random index by invoking Random.Range€ with zero and the functions array length as argument. The chosen index is valid because this is the integer version of the method, for which the provided range is inclusive-exclusive.
	public static FunctionName GetRandomFunctionName () {
		var choice = (FunctionName)Random.Range€(0, functions.Length);
		return choice;
	}
We can go a step further and make sure that we never get the same function twice in a row. Do this by renaming our new method to GetRandomFunctionNameOtherThan and adding a function name parameter. Increase the first argument of Random.Range€ to 1, so index zero is never chosen at random. Then check if the choice equals the name to avoid. If so return the first name, otherwise the chosen one. Thus we substitute zero for the disallowed index, without introducing a selection bias.
	public static FunctionName GetRandomFunctionNameOtherThan (FunctionName name) {
		var choice = (FunctionName)Random.Range€(1, functions.Length);
		return choice == name ? 0 : choice;
	}
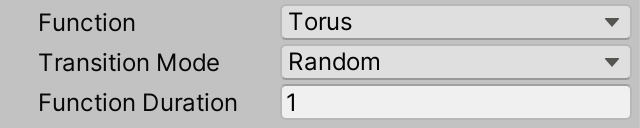
Back to Graph, add a configuration option for the transition mode, either cycle or random. Again do this with a custom enum field.
	[SerializeField]
	FunctionLibrary.FunctionName function;

	public enum TransitionMode { Cycle, Random€ }

	[SerializeField]
	TransitionMode transitionMode;
When picking the next function check whether the transition mode is set to cycle. If so invoke GetNextFunctionName, otherwise GetRandomFunctionName. As this complicates picking the next function let's put this code in a separate method as well, keeping Update simple.
	void Update () {
		duration += Time.deltaTime;
		if (duration >= functionDuration) {
			duration -= functionDuration;
			//function = FunctionLibrary.GetNextFunctionName(function);
			PickNextFunction();
		}
		UpdateFunction();
	}

	void PickNextFunction () {
		function = transitionMode == TransitionMode.Cycle ?
			FunctionLibrary.GetNextFunctionName(function) :
			FunctionLibrary.GetRandomFunctionNameOtherThan(function);
	}
Interpolating Functions
We wrap up this tutorial by making the transition between functions more interesting. Instead of suddenly switching to another function we'll smoothly morph our graph to the next one. This is also interesting for performance profiling because it requires calculating two functions at the same time during a transition.
Begin by adding a Morph function to FunctionLibrary that will take care of the transition. Give it the same parameters as the function methods, plus two Function parameters and a float parameter to control the morph progress.
	public static Vector3 Morph (
		float u, float v, float t, Function from, Function to, float progress
	) {}
We're using Function parameters instead of FunctionName parameters because that way Graph can retrieve the functions by name once per update, so we won't have to access the functions array twice per point.
The progress is a 0–1 value that we'll use to interpolate from the first provided function to the second one. We can use the Vector3.Lerp function for this, passing it the result of both functions and the progress value.
	public static Vector3 Morph (
		float u, float v, float t, Function from, Function to, float progress
	) {
		return Vector3.Lerp(from(u, v, t), to(u, v, t), progress);
	}
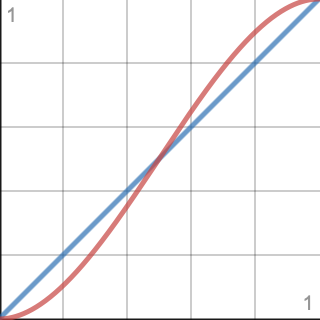
Lerp is shorthand for linear interpolation. It will produce a straight constant-speed transition between the functions. We can make it look a bit smoother by slowing down the progress near the start and end. This is done by replacing the raw progress with an invocation of Mathf.Smoothstep with zero, one, and the progress as arguments. It applies the `3x^2-2x^3` function, commonly known as smoothstep. The first two parameter of Smoothstep are an offset and scale for this function, which we don't need so use 0 and 1.
return Vector3.Lerp(from(u, v, t), to(u, v, t), SmoothStep(0f, 1f, progress));
The Lerp method clamps its third argument so it falls in the 0–1 range. The Smoothstep method does this as well. We configured the latter to output a 0–1 value, so the extra clamp of Lerp is not needed. For cases like this there is an alternative LerpUnclamped method, so let's use that one instead.
		return Vector3.LerpUnclamped(
			from(u, v, t), to(u, v, t), SmoothStep(0f, 1f, progress)
		);
Transitioning
The transition period between functions requires a duration, so add a configuration option for it to Graph, with the same minumum and default as the function duration.
	[SerializeField, Min(0f)]
	float functionDuration = 1f, transitionDuration = 1f;
Our graph can now be in two modes, either transitioning or not. We'll keep track of this with a boolean field, which has the bool type. We also need to keep track of the name of the function from which we are transitioning.
	float duration;

	bool transitioning;

	FunctionLibrary.FunctionName transitionFunction;
The UpdateFunction method works for displaying a single function. Duplicate it and rename the new one to UpdateFunctionTransition. Change it so it gets both functions and calculates the progress, which is the current duration divided by the transition duration. Then have it invoke Morph instead of a single function in its loop.
	void UpdateFunctionTransition () {
		FunctionLibrary.Function
			from = FunctionLibrary.GetFunction(transitionFunction),
			to = FunctionLibrary.GetFunction(function);
		float progress = duration / transitionDuration;
		float time = Time.time;
		float step = 2f / resolution;
		float v = 0.5f * step - 1f;
		for (int i = 0, x = 0, z = 0; i < points.Length; i++, x++) {
			…
			points[i].localPosition = FunctionLibrary.Morph(
				u, v, time, from, to, progress
			);
		}
	}
At the end of Update check whether we're transitioning. If so invoke UpdateFunctionTransition, otherwise UpdateFuction.
	void Update () {
		duration += Time.deltaTime;
		if (duration >= functionDuration) {
			duration -= functionDuration;
			PickNextFunction();
		}

		if (transitioning) {
			UpdateFunctionTransition();
		}
		else {
			UpdateFunction();
		}
	}
Once the duration exceeds the function duration we move on to the next one. Before picking the next function indicate that we're transitioning and make the transition function equal to the current function.
		if (duration >= functionDuration) {
			duration -= functionDuration;
			transitioning = true;
			transitionFunction = function;
			PickNextFunction();
		}
But if we're already transitioning we have to do something else. So first check whether we're transitioning. Only if that's not the case do we have to check whether we exceeded the function duration.
		duration += Time.deltaTime;
		if (transitioning) {}
		else if (duration >= functionDuration) {
			duration -= functionDuration;
			transitioning = true;
			transitionFunction = function;
			PickNextFunction();
		}
If we are transitioning then we have to check whether we exceeded the transition duration. If so deduct the transition duration from the current duration and switch back to the single function mode.
		if (transitioning) {
			if (duration >= transitionDuration) {
				duration -= transitionDuration;
				transitioning = false;
			}
		}
		else if (duration >= functionDuration) { … }
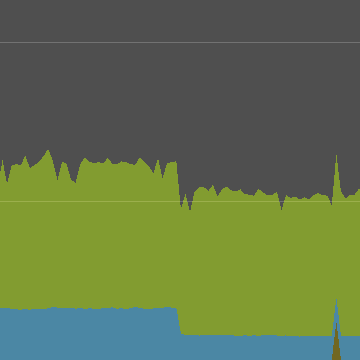
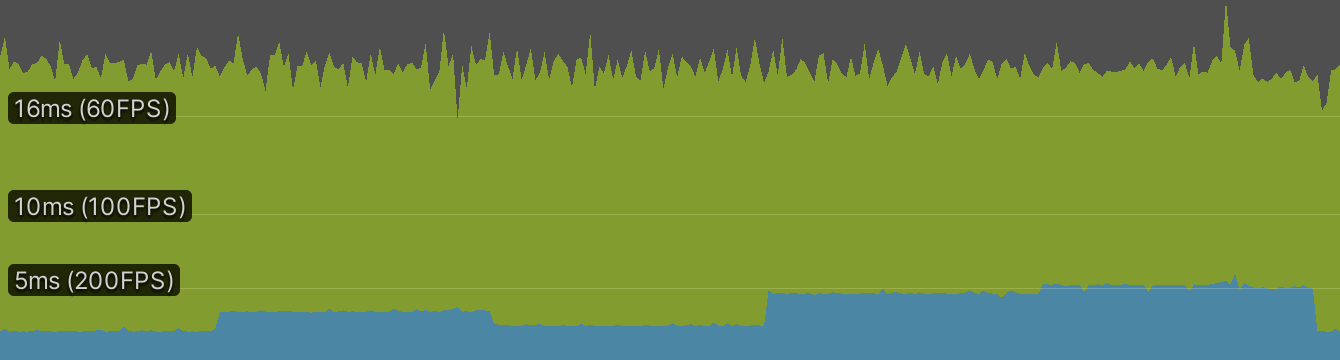
If we profile now we can see that indeed during transitions Graph.Update takes significantly longer. Exactly how much time it takes depends on between which functions it blends.
It bears repeating that the profiling results you get depend on your hardware and can be quite different from the examples I've shown in this tutorial. When developing your own app decide what minimum hardware specifications you support and test with those. Your development machine is only for preliminary testing. If you're targeting multiple platforms or hardware specifications then you'll need multiple testing devices.
The next tutorial is Compute Shaders.